
Arcadia Finance conducted a 2024 survey on the financial situation of South Africans, revealing insights into household finances and expectations that influence both daily decisions and the broader economy. Economic pressures, driven by rising inflation and interest rates, have significantly impacted the financial well-being of many South Africans. This study explores how South Africans view their current financial situation and the factors shaping their financial choices.
Based on a comprehensive survey of 181 respondents from diverse backgrounds, the study captures essential insights into financial satisfaction, spending patterns, and future expectations. Most respondents shared their views toward the end of September 2024.
Key areas of the survey include how much income remains after essential expenses, perceptions of government financial management, and shifts in financial situations compared to last year. It also examines budgeting habits, household debt, and adjustments made or planned to manage finances better.
This report provides a current snapshot of how South African households are adapting to a challenging economic climate and offers a closer look at the decisions shaping their financial futures. The aim is to present a clear picture of the economic outlook from the perspective of ordinary citizens.
Respondents had the flexibility to skip questions if they preferred, so response totals may not add up to a full 100%. This approach allows a more accurate reflection of respondents’ willingness to share specific details, ensuring a respectful and inclusive survey environment.

Age distribution of respondents
The age distribution of respondents shows that 12% are under 30, while 60% fall within the 30-50 age range. Additionally, 24% of respondents are between 51 and 65 years old, and only 4% are aged 65 or older. This breakdown highlights that the majority of respondents are in the 30-50 age range, with fewer participants in both the younger and older age categories.

Gender of Respondents
Men (51.4%) slightly outnumbered women (48.1%) among the respondents. A small proportion (0.6%) of respondents identified as another gender or chose not to disclose their gender.

Type of Housing of Respondents
The largest portion of respondents (40.8%) reported living in a rented apartment, followed by 35.8% who live in a home they own. A smaller percentage live in other housing types: 7.3% reside in a right-of-occupancy apartment, 8.4% live in a spouse’s apartment, 3.9% in an employee apartment, and 3.9% in an owned apartment.

Current Employment Status
The majority of respondents (79.4%) reported being in permanent employment. Other employment categories include temporary employees (5%), entrepreneurs (5%), pensioners (5.6%), unemployed respondents (3.3%), and students (1.7%). This indicates a strong presence of permanently employed individuals among the respondents, with smaller groups in other employment statuses.

Monthly Income of the Sample After TAX
Monthly net income varies significantly. The majority of respondents earned between R3 500 and R10 000 per month after tax, representing 52.8% of the sample. Another substantial group earned between R10 000 and R20 000, making up 27.8% of the respondents. The lowest income earners, those earning between R0 and R3 500, constituted 8.5%, while higher income brackets, with earnings above R20 000, accounted for 10.2% of the total.
How Satisfied Are Respondents With Their Financial Situation?
The financial strain brought on by the post-pandemic environment, compounded by inflation and persistently high interest rates, has put considerable pressure on household budgets. This section explores how these economic challenges are impacting consumer satisfaction, both with their personal financial circumstances and with the government’s economic management.
We analyze the responses to the following research questions:
- How satisfied are you with your own financial situation?
- How satisfied are you with the government’s handling of economic matters?
How Satisfied Are You With Your Personal Financial Situation?
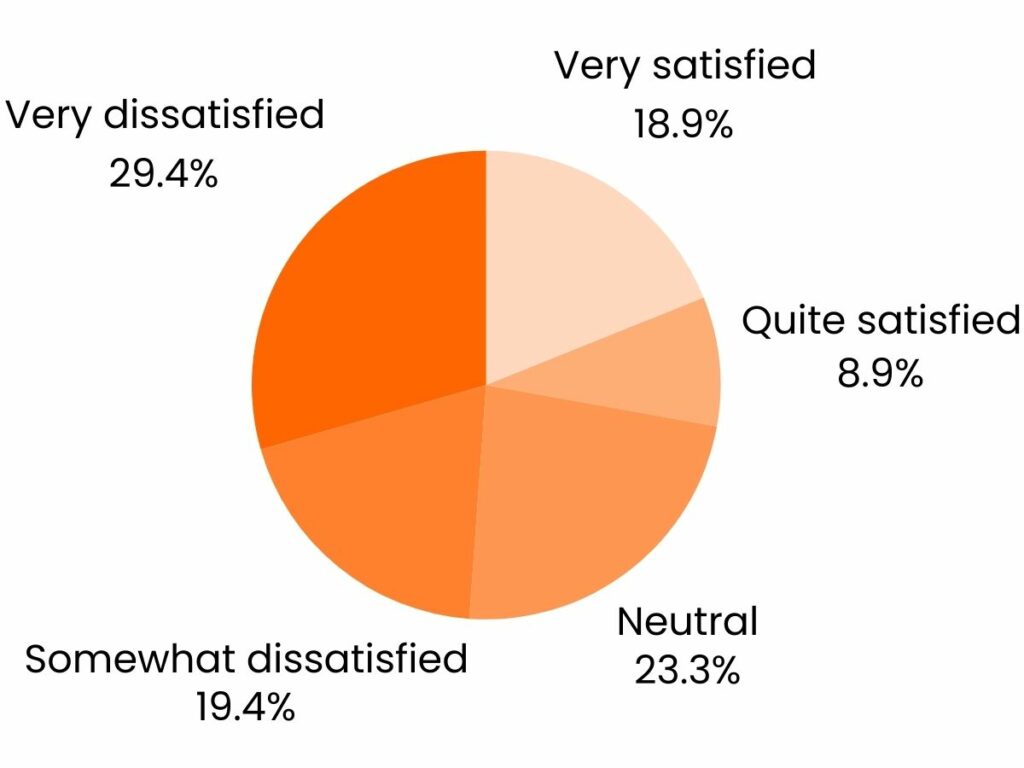
The survey results indicate a low overall satisfaction with personal financial situations among respondents. A total of 48.8% expressed dissatisfaction, with 29.4% being “very dissatisfied” and 19.4% “somewhat dissatisfied.” Around 18.9% of respondents felt “very satisfied” with their financial situation, while 8.9% were “quite satisfied.” Additionally, 23.3% of respondents reported a neutral stance, suggesting they may feel their financial situation is stable but not particularly good, possibly reflecting adequate yet unsatisfactory financial circumstances.
Is the Government’s Economic Management Successful?
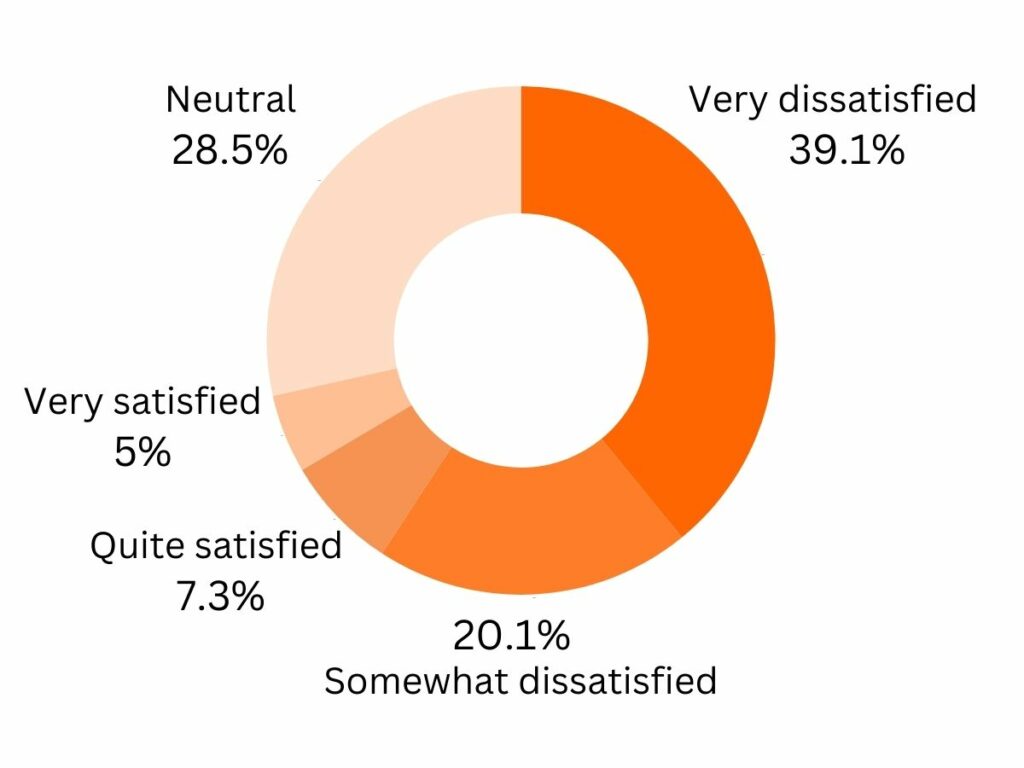
Dissatisfaction is evident when reviewing respondents’ opinions on the government’s management of the economy. A significant majority, 59.2%, voiced dissatisfaction, of which 39.1% were “very dissatisfied” and 20.1% “somewhat dissatisfied.” This reflects a widespread negative sentiment toward the government’s economic policies. Many feel that government actions have not effectively addressed economic challenges, leaving a large group unconvinced about their impact.
Only 12.3% expressed satisfaction with the government’s actions. Of these, 7.3% were “quite satisfied,” while a mere 5.0% were “very satisfied.” The low satisfaction rate highlights a lack of confidence in the government’s handling of economic matters. Many respondents appear to experience the effects of economic policies negatively in their daily lives, which amplifies discontent.
A neutral view was taken by 28.5% of respondents. This could suggest that some individuals feel the impact of government decisions is limited or unclear, neither significantly improving nor worsening their personal situation. These neutral responses may reflect a perception of stagnation rather than active improvement or decline.
Overall, the results reveal that dissatisfaction with economic conditions is prevalent, both on a personal level and in perceptions of government actions. The widespread sense of discontent may stem from economic uncertainties and a lack of faith in economic management. Only a small proportion appear to feel positively about the government’s actions, indicating that economic concerns are a significant source of anxiety. The results suggest that economic instability and skepticism toward policy decisions continue to shape both personal and broader societal attitudes.
How Have Consumers’ Financial Resources Changed?
As the results indicate, a considerable portion of respondents perceive their financial situation negatively, reflecting a broader sense of economic dissatisfaction. The high level of discontent highlights the challenges people face, with many feeling their financial resources have either stagnated or worsened. This widespread sentiment emphasizes the underlying economic pressures impacting daily life and shaping a critical view of the current economic environment. Let’s explore these perceptions further to understand the roots of dissatisfaction and the factors contributing to the strained financial resources reported by respondents.
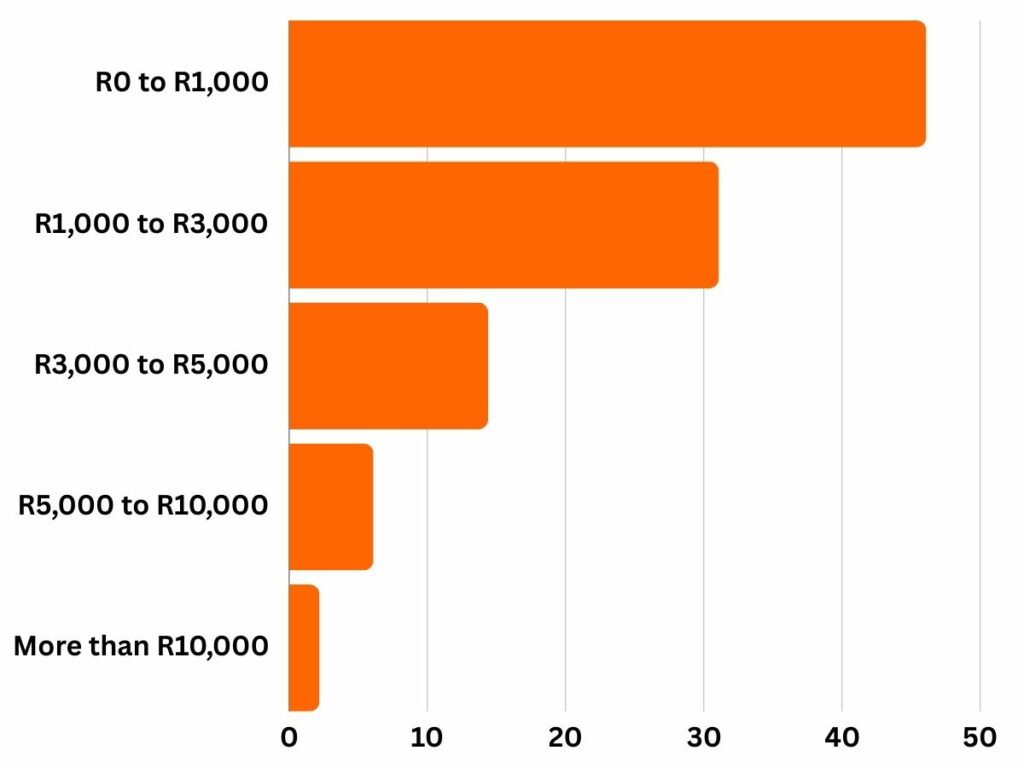
How Much Money Is Left to Spend After Essential Expenses Each Month?
This research question aimed to uncover the financial situation of respondents after paying for essential expenses, highlighting the funds they can use for discretionary spending. The results indicate that most respondents have a very limited amount left over each month. Specifically, 46.1% reported having only R0 to R1,000 remaining, while another 31.1% indicated they have between R1,000 and R3,000 available. This suggests that many people experience financial constraints that limit their ability to spend on non-essential items.
A smaller proportion of respondents, 14.4%, have R3,000 to R5,000 left to spend, and only 6.1% have between R5,000 and R10,000. The smallest group, just 2.2%, reported having more than R10,000 left after covering essential expenses. This indicates that only a minority have significant financial flexibility, while the majority struggle to manage with limited remaining funds after essential spending.
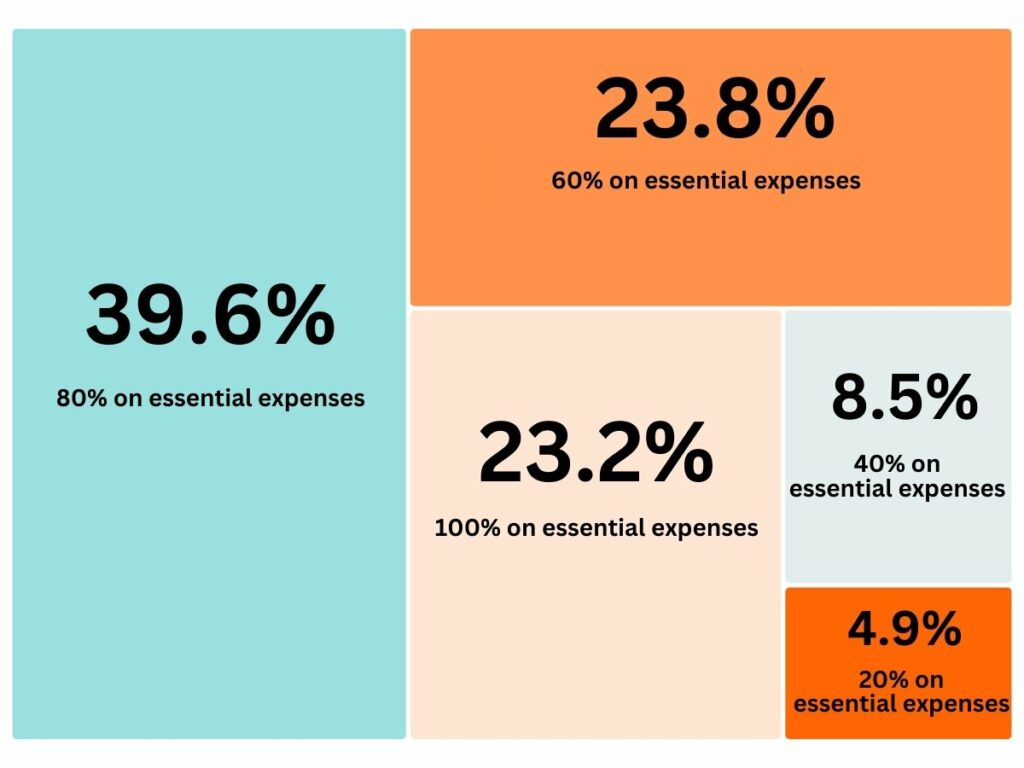
What Proportion of Your Income Goes to Essential Expenditure Compared to Other Expenses?
The results show that a significant proportion of respondents allocate most of their income to essential expenses. Specifically, 39.6% of respondents spend about 80% of their income on needs, while 23.8% spend 60% on essential expenses. Additionally, 23.2% of respondents allocate their entire income (100%) to essential needs, with nothing left for discretionary spending.
Only 8.5% reported spending 40% on needs and 60% on wants, while a small group of 4.9% indicated that only 20% of their income goes to needs, with 80% available for discretionary spending. These findings suggest that the majority of respondents face significant financial constraints that limit spending flexibility.
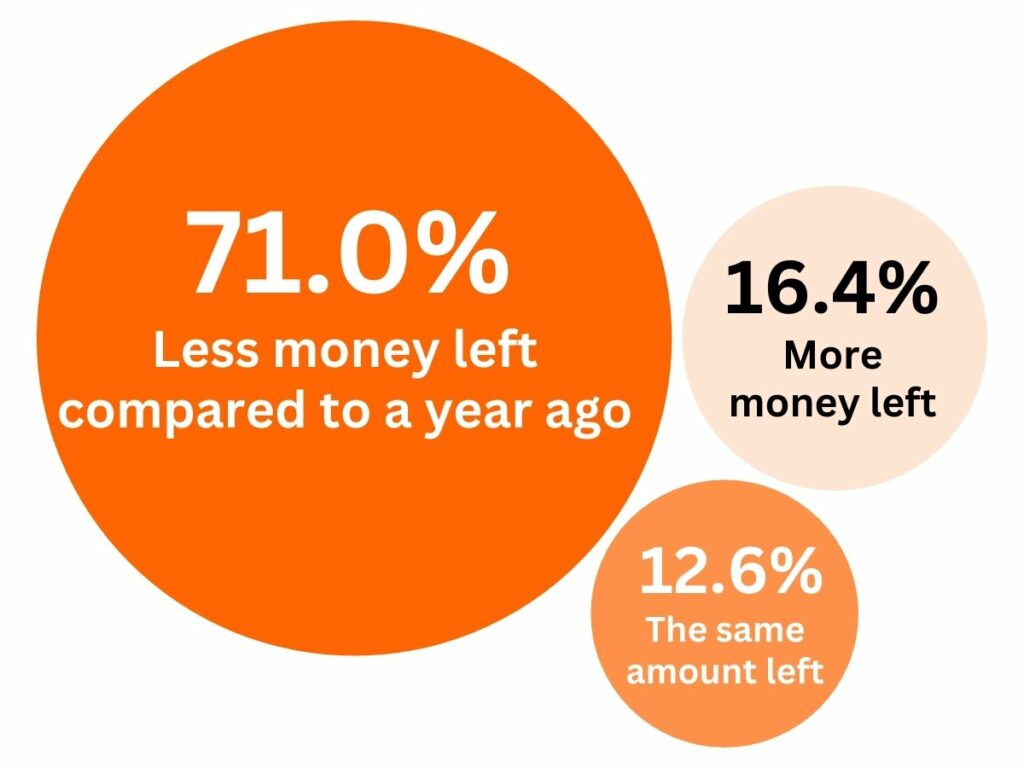
How Much Money Is Left for Your Household to Spend Each Month After Essential Expenses Compared to a Year Ago?
The survey results reveal a concerning trend in the financial situation of respondents. A substantial majority, 71%, reported having less money left to spend after essential expenses compared to a year ago, highlighting growing financial challenges.
Only 12.6% of respondents indicated that the amount they have available has remained the same, suggesting that this group has managed to maintain financial stability despite economic pressures. Meanwhile, 16.4% of respondents stated that they have more money available than a year ago, representing a smaller segment experiencing improved financial flexibility.
These responses suggest that the financial strain has intensified for a significant portion of the population over the past year.
Have You Had to Change Your Household Budget in the Last 6 Months?
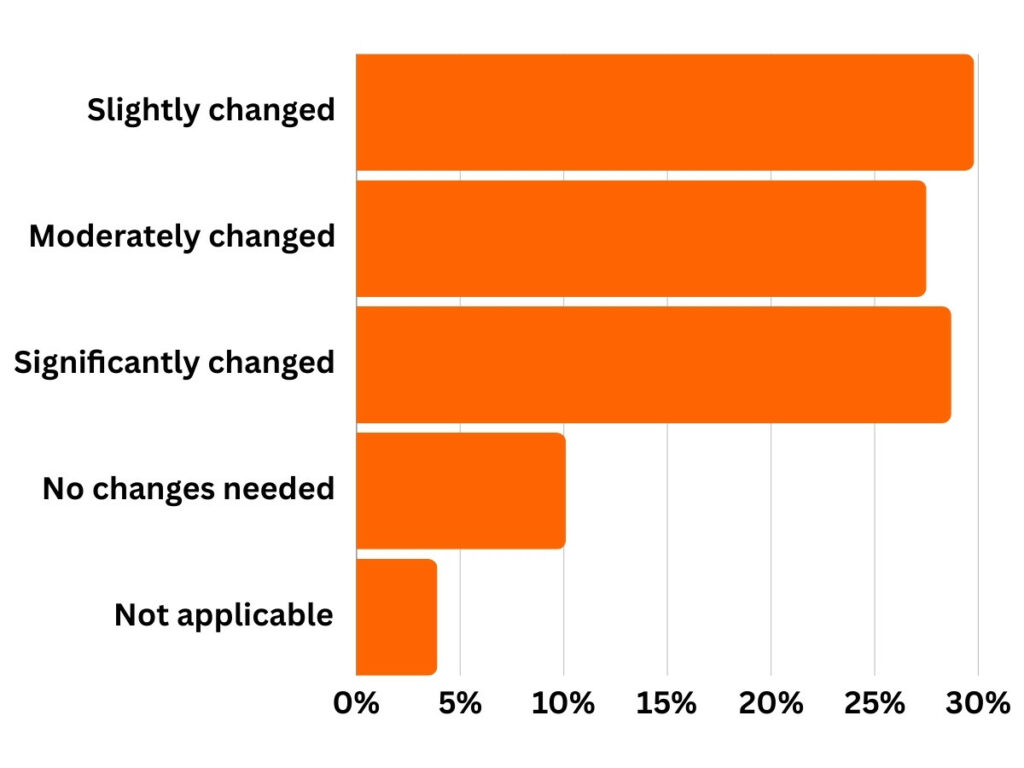
The survey results reflect a significant level of financial adjustment among respondents, with 86% reporting changes to their household budgets over the last six months. Specifically, 29.8% of respondents indicated that they have “slightly changed” their budget, reflecting minor but necessary alterations, likely in response to rising living costs or adjustments in discretionary spending. Another 28.7% of respondents reported “significantly changed” budgets, suggesting substantial financial rearrangements, perhaps driven by major economic shifts or increased financial strain. Additionally, 27.5% stated that they have “moderately changed” their budgets, indicating a balanced yet impactful shift in financial management.
These findings reveal that most respondents are actively working to adapt to economic conditions, such as inflation, fluctuating utility costs, or unexpected financial obligations. This substantial proportion of individuals having to readjust their financial plans emphasizes the pervasive impact of the current economic climate on households.

On the other hand, only 10.1% of respondents reported that “no changes were needed,” suggesting a small segment of the population that has been able to maintain stability in their financial situation despite broader economic challenges. This group likely has a more secure financial footing or greater income stability. Additionally, 3.9% of respondents selected “not applicable,” which could reflect individuals who are not responsible for managing their household finances, such as those living in shared financial arrangements or dependents who do not oversee budgeting.
The data underscores that the majority of people have had to make strategic decisions and sacrifices to balance their finances, whether through cutting back on non-essential expenses, reallocating funds, or making more substantial changes. The responses suggest that economic uncertainty and financial pressures are prompting widespread reevaluation of financial priorities among many households. This may also indicate an increased emphasis on budgeting and a growing awareness of financial planning as individuals seek to navigate these turbulent times.
Expectations for the Future
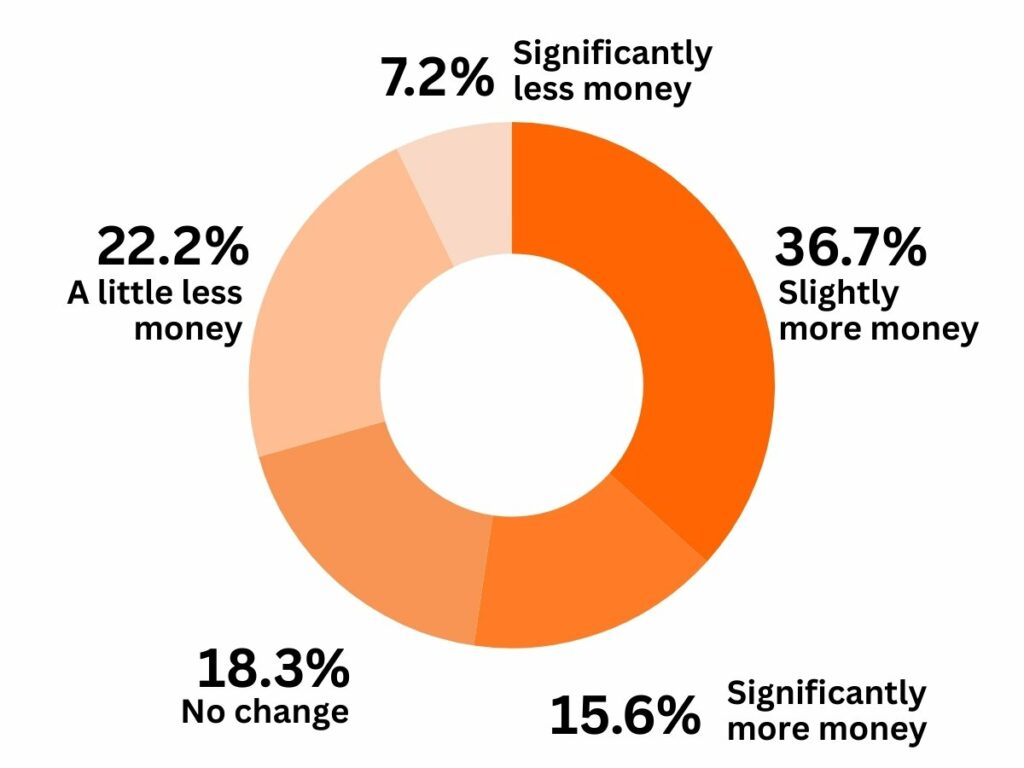
The survey reveals a mixed outlook on future financial expectations. A significant proportion of respondents, 36.7%, are cautiously optimistic, believing they will have “slightly more” money left in their finances each month over the next 12 months. This reflects a hopeful sentiment among many that economic conditions or personal financial situations may improve modestly.
However, a notable 22.2% of respondents expect to have “a little less” money, indicating concerns about potential financial pressures in the near future. Additionally, 18.3% of respondents anticipate “no change” in their financial situation, suggesting that a considerable group expects stability rather than improvement or worsening conditions.
On the more extreme ends of the spectrum, 15.6% of respondents are highly optimistic, expecting “significantly more” money left each month, while 7.2% hold a pessimistic view, predicting they will have “significantly less” financial flexibility. This distribution suggests that while there is moderate optimism, there are also significant concerns about potential financial difficulties.
Overall, the responses illustrate a wide range of economic expectations, from cautious optimism to financial apprehension. The varying predictions reflect the uncertainty many people feel about the future, influenced by economic factors, job security, or changing financial responsibilities.
Find out more about why loan interest rates go up and how you can plan ahead to stay financially secure.
Most Popular Financial Products Now and in the Near Future
Beyond analyzing the economic climate, the survey delves into questions about financial products, which shed light on how economic conditions influence preferences for these products. The relationship is often intertwined: during economic downturns, businesses may be hesitant to take on debt for investment purposes. However, investment is essential to drive economic growth and increase productivity, both of which are crucial for economic recovery.
The survey responses provide insights into the current use and future considerations of financial products. Here, we review the data and examine answers to the following questions:
- Do you currently have loans or debts? If so, what types?
- Are you holding any unsecured loans? If yes, which types?
- Have you used any financial products in the past 6 months? If so, which ones?
- Are you considering taking out an unsecured loan in the next 12 months due to your financial situation?
What Types of Loans Do Consumers Currently Have?
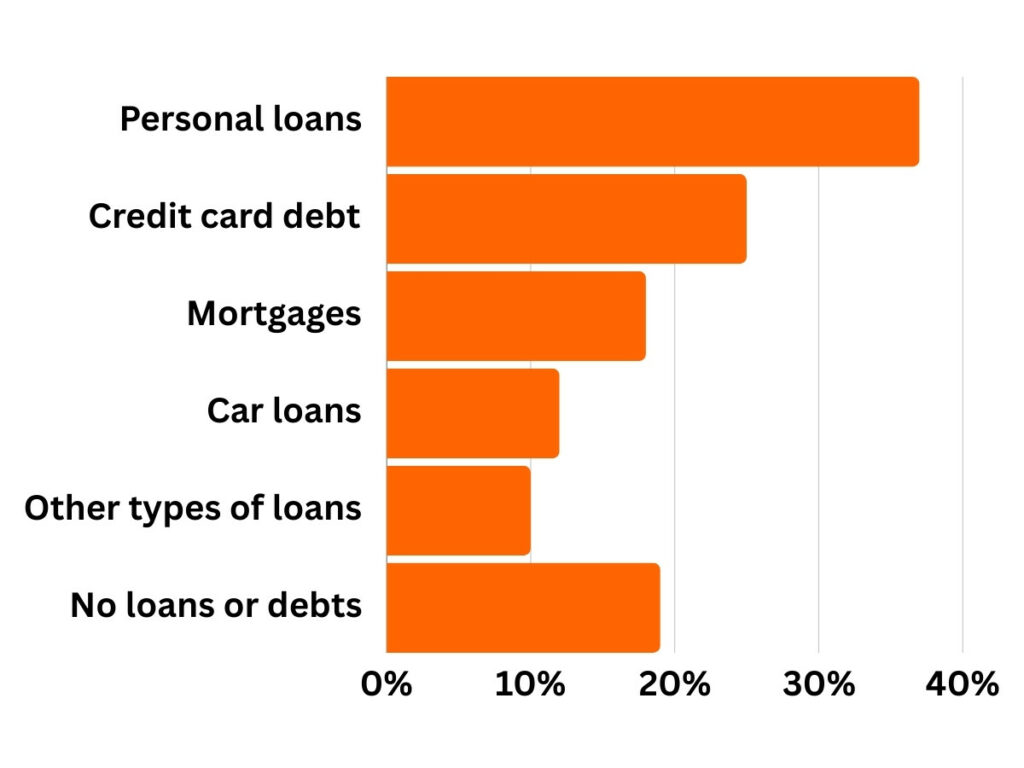
The survey reveals that consumers hold a diverse range of loans and debts, reflecting the varied needs and preferences in the loan market. The most common types of loans include personal loans, mortgages, and car loans, indicating that consumers are leveraging different financial products to manage their expenses and investments.
Personal loans are the most frequently cited, with 37% of respondents indicating they currently have this type of loan. This prevalence suggests that personal loans are a popular choice, likely due to their flexibility for covering a range of expenses. Credit card debt is also prominent, with 25% of respondents reporting outstanding balances on credit cards, highlighting their widespread use as both a payment and financing tool.
Mortgages are a significant part of consumer debt, with 18% of respondents stating they have a mortgage. This underscores the importance of homeownership financing as a key aspect of personal finance. Car loans are held by 12% of respondents, reflecting the necessity for vehicle financing among consumers.
In addition to these more common loan types, 10% of respondents reported having other types of loans, indicating the use of specialized or less conventional forms of credit. Notably, 19% of respondents stated that they do not have any loans or debts, which may suggest either financial independence or a preference for avoiding borrowing.
The survey also shows that unsecured loans are a major component of consumer borrowing, with many respondents relying on them for financial flexibility. The data reveals that consumers value access to loans that do not require collateral, using them to manage everyday expenses or finance larger purchases. The variety in loan types illustrates the broad spectrum of financial needs and the strategies people employ to manage their financial obligations.
How Willing Are Consumers to Take Out Personal Loans in the Next Year?
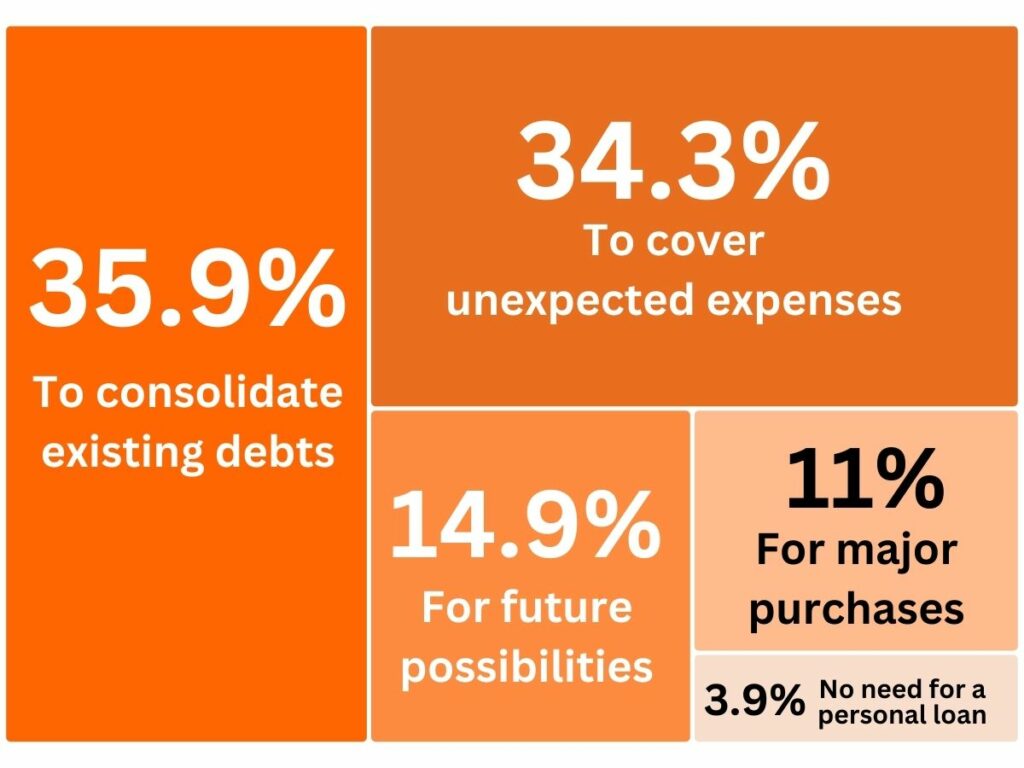
The survey results indicate that a significant proportion of respondents are considering taking out a personal loan in the near future. The most common reason, cited by 35.9% of respondents, is to consolidate existing debts. This suggests that many consumers are looking to simplify loan management and potentially reduce interest payments, highlighting the financial pressure of managing multiple debts.
Nearly as many respondents, 34.3%, would consider taking out a personal loan to cover unexpected expenses. This reflects the importance of financial flexibility in dealing with unforeseen costs, indicating that many are preparing for potential emergencies or sudden financial needs.
A smaller but notable 14.9% of respondents are open to the idea of taking out a personal loan for future possibilities, even if they do not have an immediate need. This cautious consideration suggests that while these individuals are currently managing, they remain aware of potential financial challenges ahead.
Loans for major purchases were considered by 11% of respondents, pointing to planned expenses that may require additional financing. Finally, only 3.9% of respondents do not see any need for a personal loan, emphasizing that the majority of consumers are at least open to the idea of borrowing if their financial situation demands it.
Overall, the results highlight that many consumers are actively thinking about financial strategies to manage debts, cover emergencies, or fund significant expenditures, demonstrating both the financial pressures and planning behaviors prevalent among the respondents.
By combining your debts into one manageable payment, you can reduce financial stress and even lower your overall interest rate. Learn more about what debt consolidation can do for you and decide if it’s the right choice for your financial future.
Respondents’ Main Criteria for Taking Out a Loan
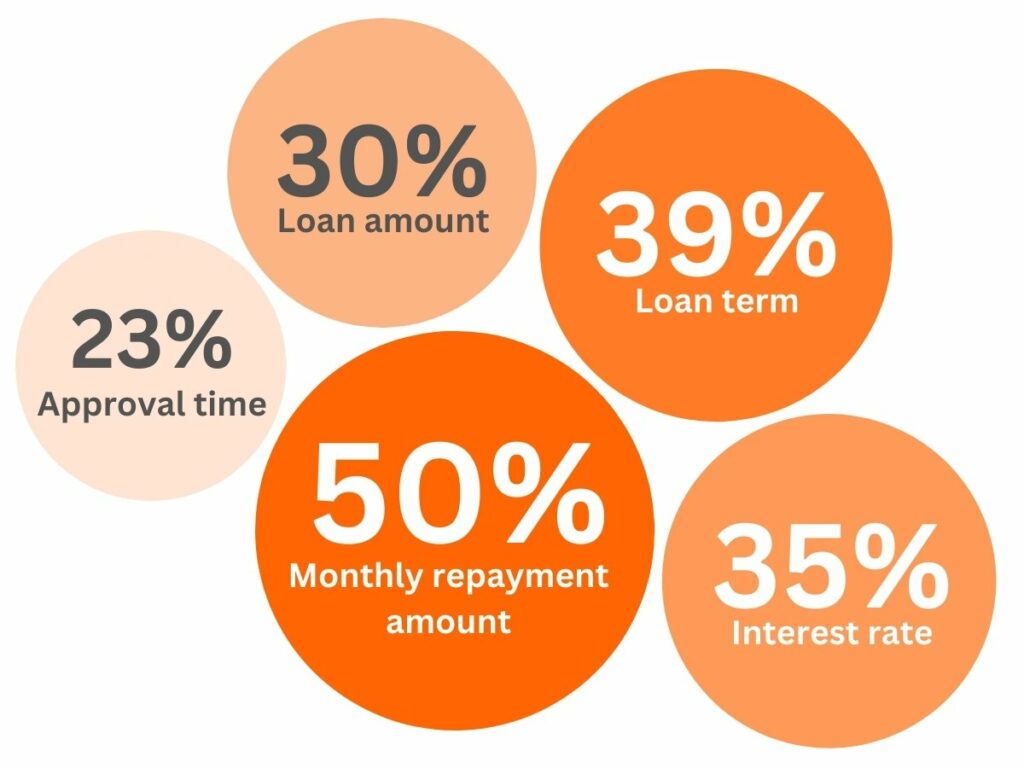
The survey results highlight the factors most important to consumers when deciding to take out a loan. The most frequently mentioned criterion is the monthly payment amount, cited by 50% of respondents. This underscores a widespread need for financial predictability and manageable installments that align with personal budgets.
The loan term (duration) follows, cited by 39% of respondents, reflecting its importance in helping consumers manage their finances over the loan’s length. Similarly, the loan price or interest rate is a key consideration for 35% of respondents, emphasizing the need for affordability and minimizing the long-term cost of borrowing.
Other notable factors include the loan amount, mentioned by 30% of respondents, and approval time (quick), which was important for 23% of respondents. Additional considerations such as the simplicity of the application process, lender reputation, and customer service quality were also highlighted, further indicating a preference for lenders who provide a seamless and supportive borrowing experience.
Dreaming of better loan terms or greater financial flexibility? Your credit score holds the key! Discover practical tips to boost your score, avoid common pitfalls, and unlock the best deals with our guide on how to improve your credit score.
About Arcadia Finance
Arcadia Finance makes securing your loan simple and stress-free. Explore options from 19 reliable lenders, fully accredited by South Africa’s National Credit Regulator. Take advantage of a transparent, fee-free application process designed for your financial goals.
Conclusion
The responses from the South African consumer survey provide a compelling insight into the most important criteria consumers consider when deciding to take out a loan. The survey highlights that financial predictability and the overall cost of a loan are critical factors shaping consumer preferences. Specifically, the most commonly cited considerations are the affordability of monthly payments and the interest rate attached to the loan. This emphasizes our responsibility as a financial service provider to offer transparent and competitive loan products that cater to our clients’ financial needs and ensure their ability to manage payments comfortably.
Furthermore, the survey indicates that flexibility and transparency are crucial. Consumers express a preference for favorable loan terms, such as longer repayment periods or minimized fees and charges, reinforcing the need for lenders to be flexible and accommodating in structuring loan agreements. It is also noteworthy that ease and speed of the application process, as well as a quick approval timeline, remain essential features valued by many. This aligns with our strategic focus on simplifying loan procedures and enhancing customer experience, which remains central to our efforts in offering user-friendly financial solutions.
Finally, while factors such as the reputation of the lender, customer service quality, and positive reviews are not as frequently highlighted, they still play a significant role in the decision-making process. These findings emphasize the importance of fostering trust and maintaining high service standards to strengthen relationships with our customers. The insights gained from this survey serve as a valuable guide for us to continuously tailor our services to better meet the needs and expectations of our clients.
Fast, uncomplicated, and trustworthy loan comparisons
At Arcadia Finance, you can compare loan offers from multiple lenders with no obligation and free of charge. Get a clear overview of your options and choose the best deal for you.
Fill out our form today to easily compare interest rates from 16 banks and find the right loan for you.


